Pydantic Logfire
Pydantic Logfire
Trusted by more than 52,000 AI teams and developers
AI Observability Platform for LLMs, Apps & AI Agents
Monitor your entire AI application stack, not just the LLM calls. Logfire is a production-grade observability platform for AI and general applications. See LLM interactions, agent behavior, API requests, and database queries in one unified trace. With SDKs for Python, JavaScript/TypeScript, and Rust, Logfire works with all OpenTelemetry-compatible languages.
Set up Pydantic Logfire in this project so it sends traces to Logfire. Follow the guide at https://pydantic.dev/docs/logfire/get-started/first-trace/.
1. Install the Logfire SDK for this project's language and initialize it at startup the way the guide describes for that language (for Python and JavaScript that is logfire.configure(); other languages may use OpenTelemetry), then instrument its web framework plus any LLM and HTTP clients. Don't refactor unrelated code.
2. Authenticate. If a `LOGFIRE_TOKEN` environment variable is already set, use it as-is. Otherwise, for a local Python project, install Logfire with the project's dependency manager (for example `uv add logfire`, `poetry add logfire`, or `pip install logfire`), then run `logfire auth` (or `uvx logfire auth`): this opens a browser where you sign in or create a free Logfire account (no credit card required) and a project, then links this machine. For another language, a non-interactive shell, or a deployment, ask me for a write token (the credential that lets an app send data to Logfire) from Project > Settings > Write tokens and set it as the `LOGFIRE_TOKEN` environment variable. Keep any token out of your replies: `logfire auth` saves credentials to `~/.logfire` in your home directory (outside the repo), and if you create or receive a token, put it in a gitignored `.env` rather than printing it; never commit it.
3. Run the app so it sends a trace, then give me the Logfire Live view link on its own line and in bold so I can open it and confirm the trace arrived.
4. Once the trace is arriving, offer a few next steps and do the ones I want: run `logfire inspect` to find other dependencies Logfire can instrument and add the relevant ones; set up the Logfire MCP (Model Context Protocol) server so you can query my Logfire data going forward (https://pydantic.dev/docs/logfire/guides/mcp-server/, it logs in through the browser); or set up alerts or evals.
Companies who trust Pydantic Logfire
Understanding
What is an AI observability platform?
An AI observability platform is a tool that provides advanced features beyond traditional monitoring. While standard monitoring tells you that a system failed, an observability tool allows you to identify the underlying causes. In the era of Large Language Models (LLMs) and autonomous agents, this distinction is critical.
An effective AI observability platform allows engineering teams to trace the lifecycle of a prompt, analyze token usage and latency per step, and benchmark model responses against groundedness and toxicity metrics.
The Full Picture
Break down silos: one tool for both AI and general observability
Most engineering teams are forced to use one observability tool for their backend application and a completely separate one for their LLMs. However, problems in production AI applications rarely come from the LLM alone. They hide in the seams: slow database queries that delay context retrieval, API timeouts during agent tool calls, inefficient vector searches, or memory leaks in background tasks. You need visibility across your entire application stack, not just the LLM calls.
What Logfire shows you
- ✓ Complete application traces from request to response
- ✓ Database queries, API calls, and business logic
- ✓ Dashboards and application metrics
- ✓ One platform with first-class AI & general observability for your entire application
What others show you
- ✗ LLM request/response only
- ✗ Missing context on performance bottlenecks
- ✗ No visibility into retrieval quality
- ✗ Separate tools for app monitoring
The Pydantic Stack
From prompt to validated output in one trace
See how Pydantic AI, AI Gateway, and Logfire work together. Define your schema with Pydantic models, extract structured data with an AI agent, route through Gateway for model flexibility, and observe the entire flow in Logfire.
OpenTelemetry-Native
Any framework with OTel instrumentation works automatically. No special Logfire integration needed. Vercel AI SDK, LangChain, FastAPI—enable OTel, point to Logfire, done.
Complete Application Traces
See your entire application: LLM calls, agent reasoning, database queries, API requests, vector searches, business logic, JS/TS frontend.
Integrated Evaluation Framework
Use Pydantic Evals to continuously evaluate LLM outputs in production. Curate datasets from production traces and catch regressions before users do.
Real-Time Cost Tracking
Track LLM API costs in real-time. Identify expensive prompts, optimize model selection, and set budget alerts. See exactly where your AI spending goes.
Pydantic AI & AI Gateway Integration
Natively integrates with Pydantic AI and Pydantic AI Gateway for model routing & budget control across all major LLM providers.
From Local Dev to Production
See all app traces in real-time as you code. Catch bugs in development, carry the same observability through to production. No tool switching, no friction.
First-Party SDKs for Python, JS/TS, Rust
Full SDKs for Python (AI frameworks), JavaScript/TypeScript (Node.js, Next.js, browsers, Cloudflare Workers, Deno), and Rust . Plus any OTel language.
Query Your Data with SQL
Drill down into your traces with SQL and use Natural Language Processing (NLP) to auto-generate your SQL queries.
Need self-hosting, SSO, or custom data retention? Talk to our team
Open Standards
Monitor your stack with OpenTelemetry
Logfire is built on OpenTelemetry, giving you a unified view of logs, traces, and metrics with no vendor lock-in. Our SDKs for Python, Rust, and TypeScript make instrumentation simple, and power features like live spans that render before they complete.
Logs
Structured and automatically redacted, with every log (span) linked to its trace. Search instantly or query with SQL.
Traces
One end-to-end timeline that combines APIs, databases, third-party calls, LLMs, and AI agents in one view.
Metrics
Track what matters to you: latency, errors, performance, cost, or any trend across your system. Set custom SLOs and alerts to keep your application reliable.
Multi-Language Support
Built for polyglot architectures
Real applications are rarely single-language. Your Python AI backend talks to a TypeScript frontend, Go microservices, and Java legacy systems. Logfire traces them all in unified, correlated views.
Python AI + TypeScript Frontend
See your agents and Next.js frontend in unified traces. Track requests from browser to AI model and back.
Microservices in Multiple Languages
Python, Go, Java, Node.js - one dashboard, complete visibility. Trace requests across service boundaries automatically.
Edge + Backend
Cloudflare Workers or Vercel Edge to Python backend, traced end-to-end. See latency at every hop.
Build with Vercel and trace with Logfire
Logfire works seamlessly with the Vercel ecosystem. Use @vercel/otel automatic server-side tracing, or our browser SDK for client-side visibility. The Vercel AI SDK has built-in OTel support - just enable it.
Integrations
Logfire works with your entire stack
Observability should not require a rewrite of your codebase. Built on open standards (OTel) with SDKs for Python, Javascript/Typescript, and Rust, Logfire supports auto-instrumentation for AI frameworks, web frameworks, databases, background workers, browsers, and more.
Python
JavaScript / TypeScript
✨ Vercel AI SDK has built-in OTel support—no special integration needed
Rust
Built on tracing + OpenTelemetry ecosystem
Any Language via OpenTelemetry
Logfire is built on OpenTelemetry. Any framework with OTel instrumentation works automatically — no special integration needed. Our listed integrations are convenient wrappers, not requirements.
Go Java .NET Ruby PHP Erlang/Elixir Swift C++
Insights
Query your data with full SQL
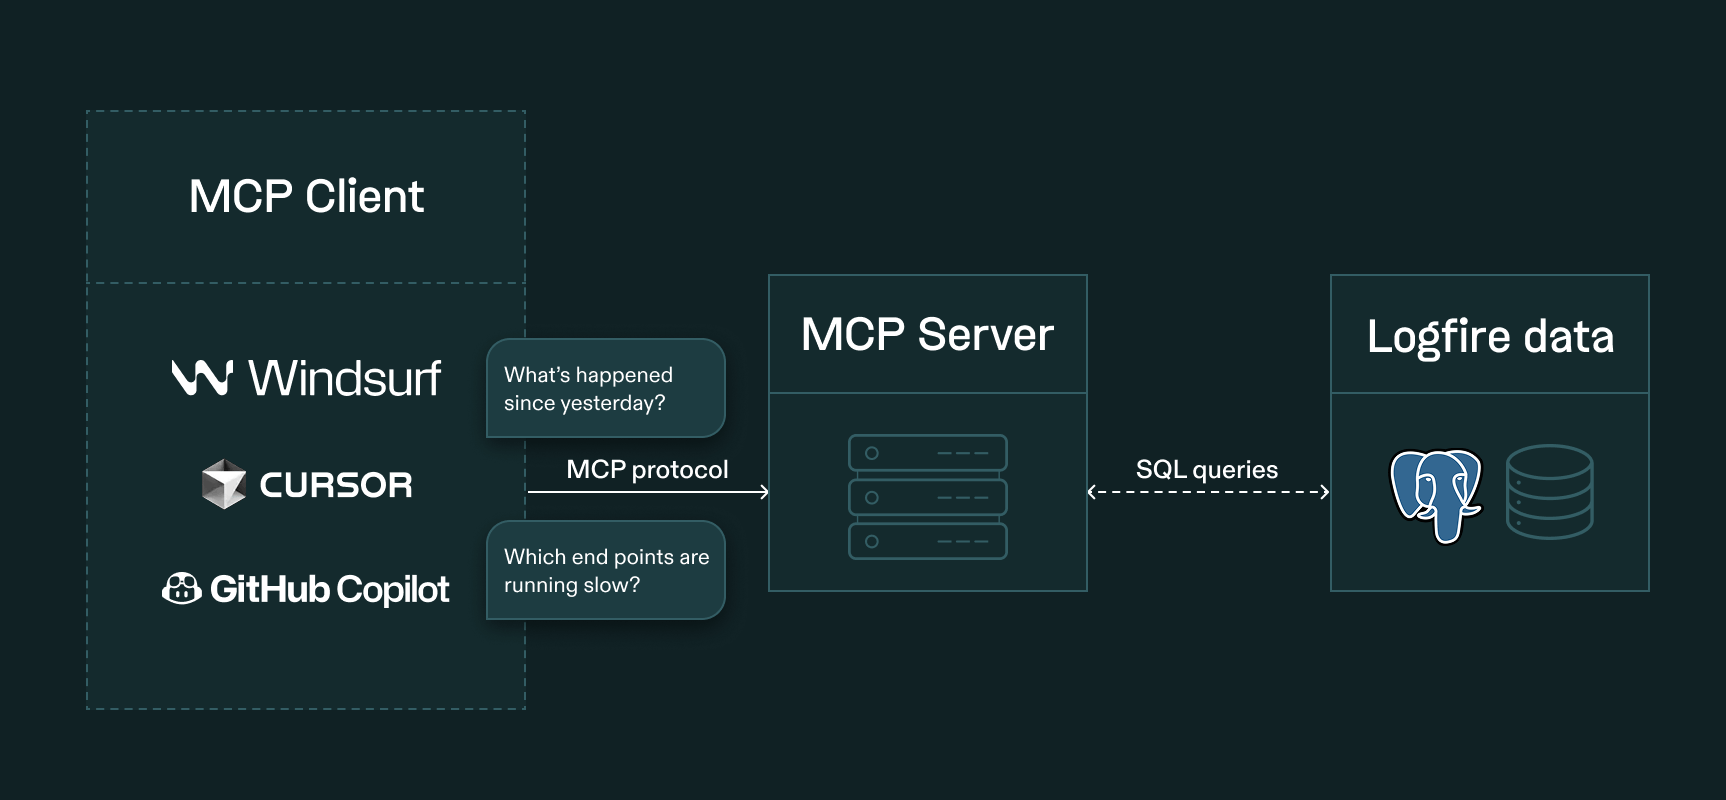
Query your data with full Postgres flavored SQL — all the control and (for many) nothing new to learn. Even if you don't like writing SQL, LLMs do, so SQL plus an MCP server lets your IDE use Pydantic Logfire as a window into your app's execution. Search for obstacles and opportunities, as you (or the AI) writes code.
With Proprietary DSLs
- • Limited to anticipated queries
- • AI assistants struggle with unfamiliar syntax
- • Constrained analysis capabilities
- • Vendor lock-in
With Logfire SQL
- • Ask any question, get any answer
- • AI assistants write excellent SQL
- • Full analytical power—JOINs, aggregations, CTEs
- • Familiar syntax—no new query language to learn
Enterprise Ready
Enterprise-level AI observability
AI applications often process sensitive user data. As a result, enterprise-level AI observability platforms need to meet strict security, compliance, and data privacy standards. Pydantic Logfire is architected to meet the rigorous governance standards of enterprise engineering teams.
Data sovereignty & self-hosting
Industries with strict data residency requirements (Finance, Healthcare, Legal) can make use of our fully self-hosted enterprise plan.
SOC2 Type II certified
Logfire is SOC2 Type II certified. We did not receive any exceptions in our report. A copy is available upon request.
HIPAA compliant
Logfire is HIPAA compliant. We are able to offer Business Associate Agreements (BAAs) to customers on our enterprise plans.
GDPR compliance & EU data region
Pydantic is fully GDPR compliant. For customers who need data kept in the EU, we offer an EU Data Region .
Logfire is already making developers' lives easier
Compare Logfire
See how Logfire compares to other observability and LLM monitoring tools.
Ready to see your complete AI application?
Start monitoring your LLMs, agents, and entire application stack in minutes. 10 million free spans per month. No credit card required.
Frequently asked questions
FOR DEVELOPERS
Ready to start building?
Logfire's has SDKs for Python, TypeScript/JavaScript, and Rust. The Python SDK is open source under the MIT license and wraps the OpenTelemetry Python package. By default, it will send data to the Logfire platform but you could send data to any OpenTelemetry Protocol (OTLP) compliant endpoint.